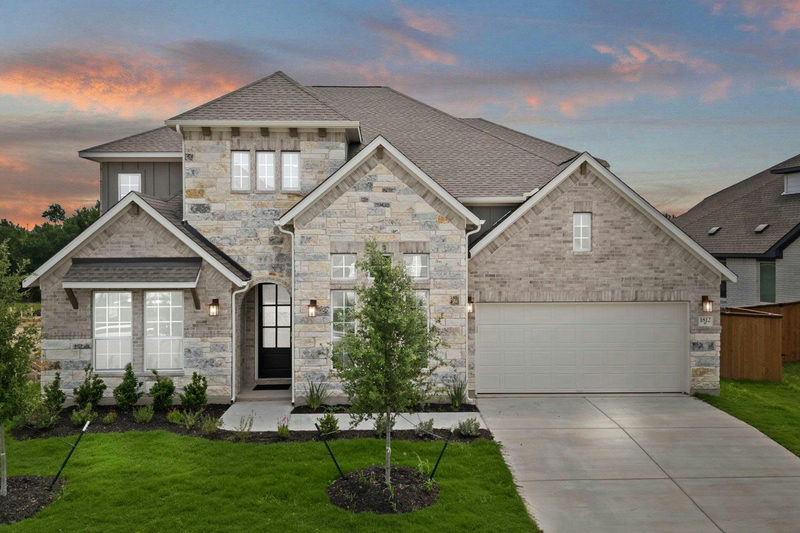
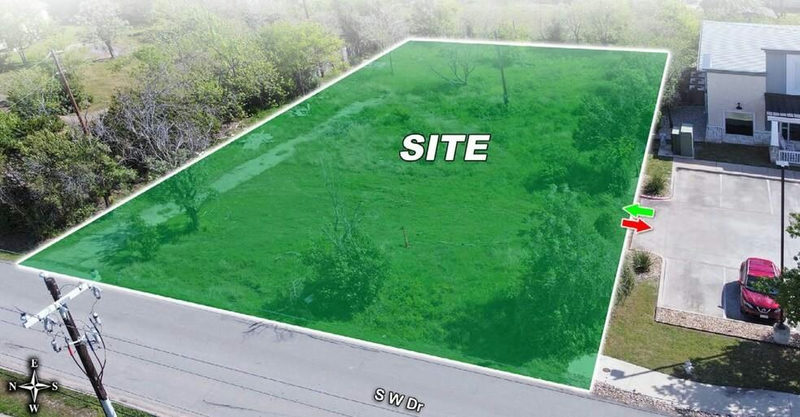
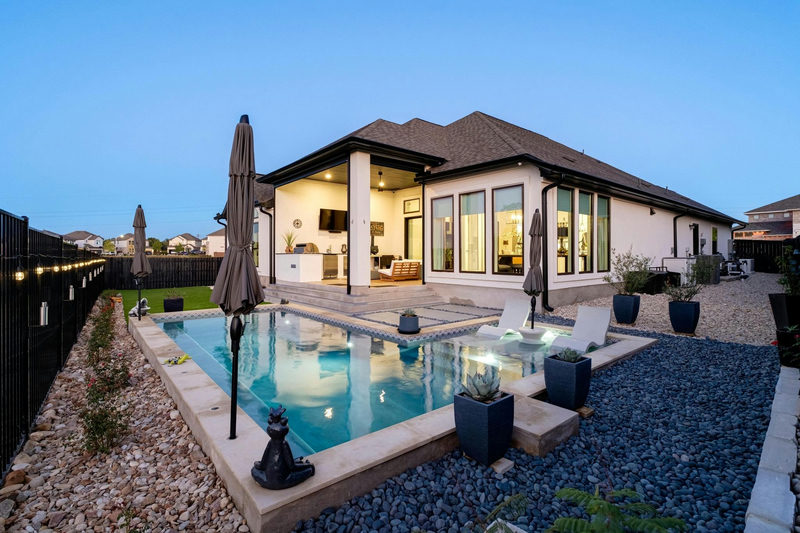
Leander · North of Cedar Park · US 183
Leander homes sold for a median $412,636 over the last 12 months, across 624 sales. 218 are for sale today, and they take about 8 weeks to go under contract.
Every active listing inside the Leander city boundary, updated from the MLS.
TBD E Evans St Leander, TX 78641
$219,000
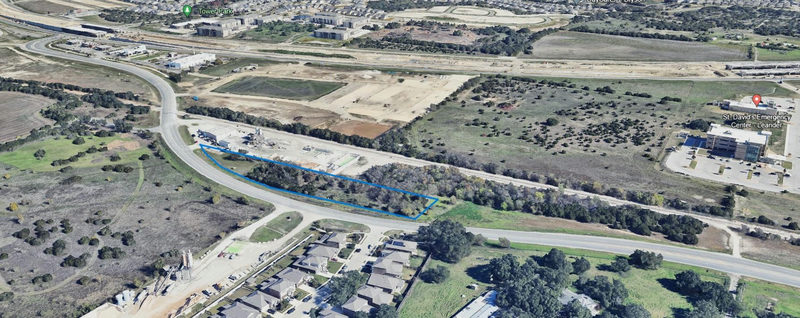
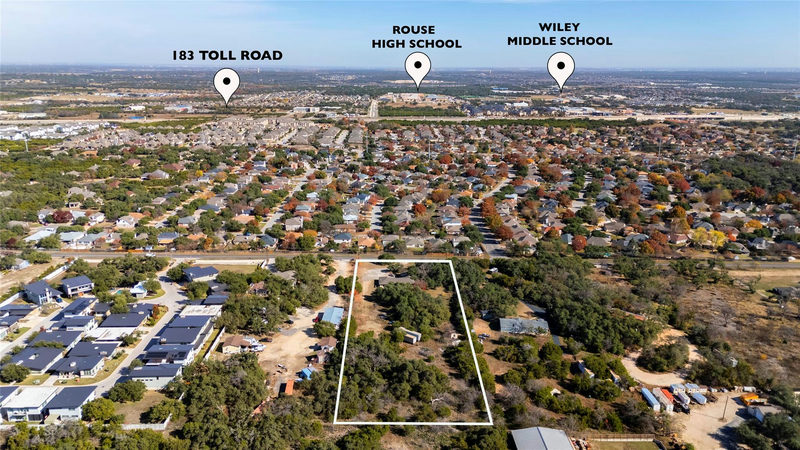
Hwy 183 Hwy 183 Leander, TX 78641
$749,000
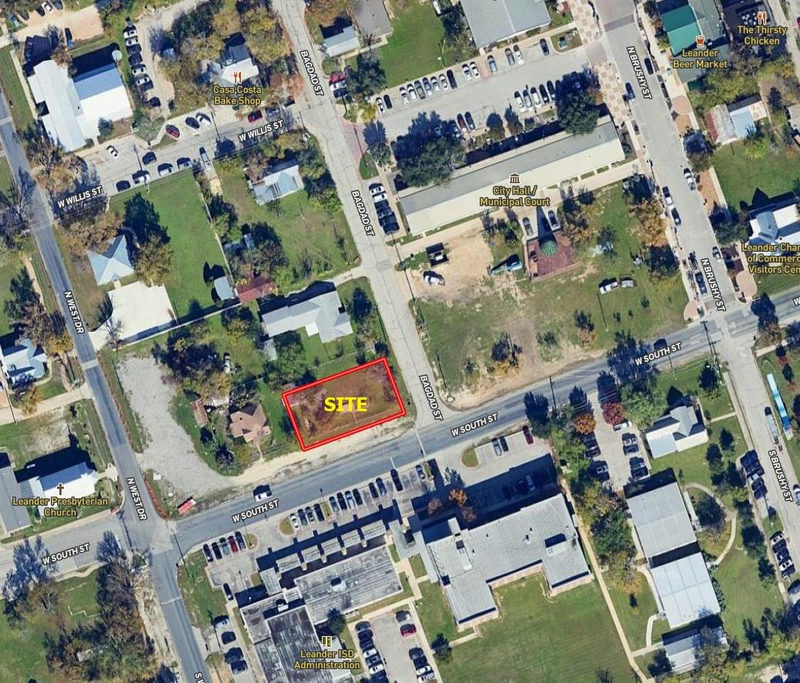
301 W South St Leander, TX 78641
$290,000
341 Coba St Leander, TX 78641
$354,999
1004 S West Dr Leander, TX 78641
$339,000
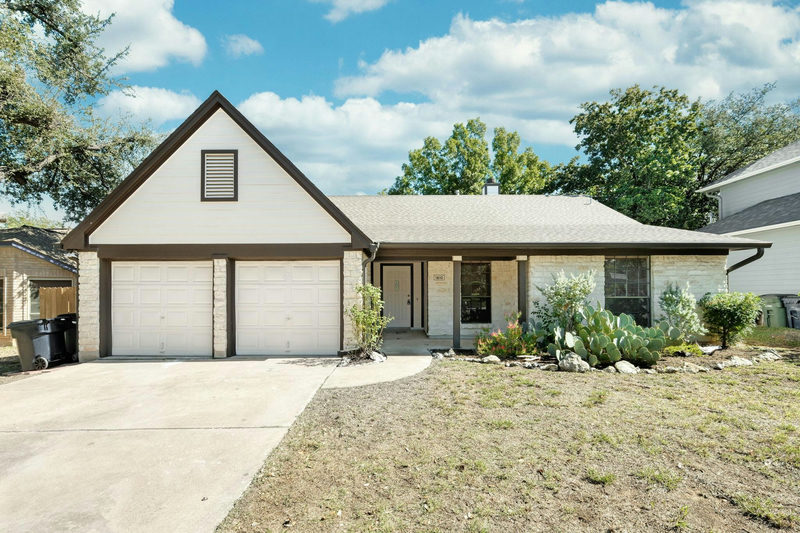
1810 Parkwood Dr Leander, TX 78641
$324,900
1240 Sweetspire St Leander, TX 78641
$329,900
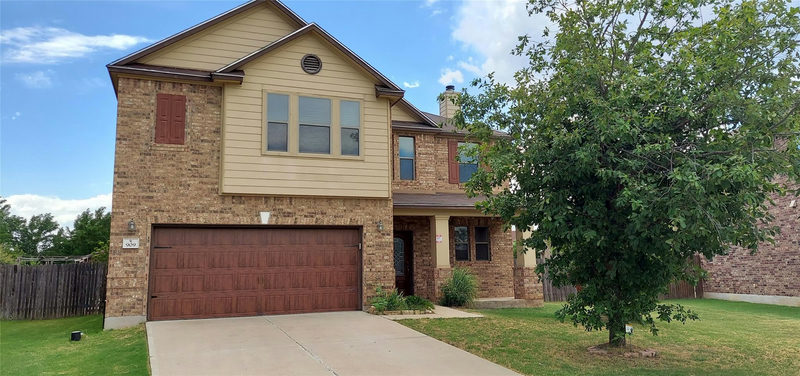
909 Lily Pad Leander, TX 78641
$430,000
1101 Horizon Park Blvd Leander, TX 78641
$680,000
1812 Camay St Leander, TX 78641
$669,900
1600 S West Dr Leander, TX 78641
$364,000
1105 Joe Carson Dr Leander, TX 78641
$849,900
Over the last 12 months, 624 homes sold inside the Leander city boundary at a median of $412,636, down 4.8% from $433,495 the year before, on 634 sales. Prices eased on similar sales volume.
The typical home went under contract in 57 days, compared with 53 days a year earlier, and sold for 94.7% of its original list price, versus 93.9% the year before. 60% of the homes that sold had cut their price at least once, the same share as a year earlier.
With 218 homes for sale and about 52.0 sales a month, Leander has 4.2 months of supply. That is a balanced market. The median home for sale today is listed at $428,000.
The median Leander sale over the last year was $412,636. Almost every sale here is a single-family house: 622 of the 624 sales. The median house had about 2,251 square feet.
Most of the housing is recent. Of the 622 houses that sold, 425 (68%) were built in 2010 or later, and 157 of all 624 sales (25%) were marked as new construction in the MLS. 44 of the 218 homes for sale today are new construction.
The median Leander home took 57 days from listing to contract over the last 12 months, counted on cumulative days on market so a relisted home is not reset to zero. A year earlier the median was 53 days. 60% of the homes that sold had cut their price at least once.
For sellers, the first price does the work. Homes that launch in line with recent sales go under contract well inside the median, and homes that launch above them tend to sit, cut, and sell for less than a well-priced launch would have brought. With new construction competing for the same buyers, builder incentives also set the bar for resale homes.
Leander sits north of Cedar Park along US 183 and the 183A toll road, roughly 25 miles north of downtown Austin, and spans parts of Williamson and Travis counties. It is the northern end of the Capital Metro MetroRail Red Line, which runs from the Leander station to downtown Austin. Most of the city is in the 78641 ZIP code.
These figures are residential closed sales (single-family, condo and townhome) from the ACTRIS MLS whose location falls inside the Leander city boundary used by our map search. Leases and sales under $40,000 are excluded. The current period is the 12 months ending September 27, 2026, compared with the 12 months before it. Days on market are cumulative. The sale-to-list figure is a median, and the active count covers residential listings only, so the map search, which also shows land and commercial listings, can show a higher total. Many homes with a Leander mailing address sit outside the city boundary and are not counted here. We publish city totals only, never an individual home's sale price.
Residential closed sales inside the Leander city boundary, ACTRIS MLS.
| Measure | Last 12 months | Prior 12 months | Change |
|---|---|---|---|
| Homes sold | 624 | 634 | -2% |
| Median sale price | $412,636 | $433,495 | -4.8% |
| Median days on market | 57 | 53 | 4 days slower |
| Sale price vs. original list | 94.7% | 93.9% | +0.8 pts |
| Share that cut price | 60% | 60% | 0 pts |
The median Leander home sold for $412,636 over the 12 months ending September 2026, across 624 residential sales inside the city boundary in the ACTRIS MLS. That is down 4.8% from $433,495 the year before. The median home for sale today is listed at $428,000. The right number for a specific home comes from the recent sales of its type and size on nearby streets, not the city median, because Leander mixes new builds with homes that are decades old.
Nearly every Leander sale is a single-family house: 622 of the 624 sales over the last 12 months, at a median of $412,636. The median house that sold had about 2,251 square feet, and 68% were built in 2010 or later. Townhomes and condos barely register inside the city boundary, so a buyer here is comparing houses by size, age and lot, and weighing resale homes against new construction. 44 of today's 218 listings are new builds.
Leander has about 4.2 months of supply as of September 2026, which is a balanced market. Buyers have room on homes that launched above recent sales: 60% of homes that sold had cut their price, and the typical home closed at 94.7% of its original list price. The median sale price is down 4.8% from a year earlier. Homes priced in line with the market still move inside the 57-day median, so negotiating room depends on how the specific home was priced.
Measured the same way, inside each city's boundary over the last 12 months, Leander's median sale was $412,636 across 624 sales. Nearby, the medians were Cedar Park at $456,000 across 642 sales and Georgetown at $472,750 across 2,718 sales. Those medians are pulled by each city's own mix of home sizes, ages and new construction, so the fair comparison is the same type and size of home in each place. Ask us for a side-by-side on the specific homes you are weighing and we will pull the matching sales.
Start with a loan pre-approval sized to the $412,636 median, or to the $428,000 median list price today. Then set up a saved search inside the Leander boundary so new listings reach you the day they list. Decide early whether you want resale or new construction: 44 of the 218 homes for sale are new builds, and builders negotiate differently than individual sellers. Budget time for an inspection, and review HOA rules and property tax rates before you commit, since both vary by subdivision.
Launching above the recent sales. Over the last year, 60% of Leander homes that sold had cut their price at least once, and the typical home closed at 94.7% of its original list price. Resale sellers here also compete with builders, who often offer rate buydowns and closing cost help: 25% of recent sales were new construction. A resale home that sits and cuts usually ends up below the price a well-set launch would have brought, and it spends extra weeks on the market getting there.
New construction is a large share of the Leander market. Over the last 12 months, 157 of the 624 sales inside the city boundary (25%) were marked as new construction in the MLS, and 425 of the 622 houses that sold (68%) were built in 2010 or later. Today 44 of the 218 homes for sale are new builds. That means a resale seller is often pricing against a builder down the road, and a buyer can compare a finished resale home with a new one before choosing.
The median Leander home took 57 days to go under contract over the last 12 months, counted on cumulative days on market so relisted homes are not reset. A year earlier the median was 53 days. Add roughly 30 to 45 days from contract to closing. A home priced in line with recent sales on launch day usually beats the median; one that needs a price cut usually takes several weeks longer, and 60% of recent sales needed one.
Leander is served mainly by the 78641 ZIP code, but a mailing address is not the same as the city boundary. In the last 12 months the MLS recorded 1,594 residential sales with a Leander address, while 624 fell inside the city boundary this page measures. Homes outside the boundary can carry the Leander name and still sit in unincorporated areas with different tax rates and services, so confirm the jurisdiction for any home you are serious about.
Request a home value from us and we will price your home against the Leander sales that actually match it: same type, similar size and age, and nearby streets, from the last 12 months of ACTRIS MLS closings. For context, the city median was $412,636 across 624 sales, and the typical home closed at 94.7% of its original list price. An online estimate cannot see condition, upgrades or lot, which drive most of the spread between similar homes.
Tell us what you are looking for, or the address you want priced. We answer within the day.