Market report · September 2026 · ACTRIS MLS
Austin-area homes sold for a median $450,000 over the last 12 months, down 2.2%, across 26,120 sales. With 11,254 homes for sale, the market has about 5.2 months of supply.
Fresh on the market across the Austin area, updated from the MLS.
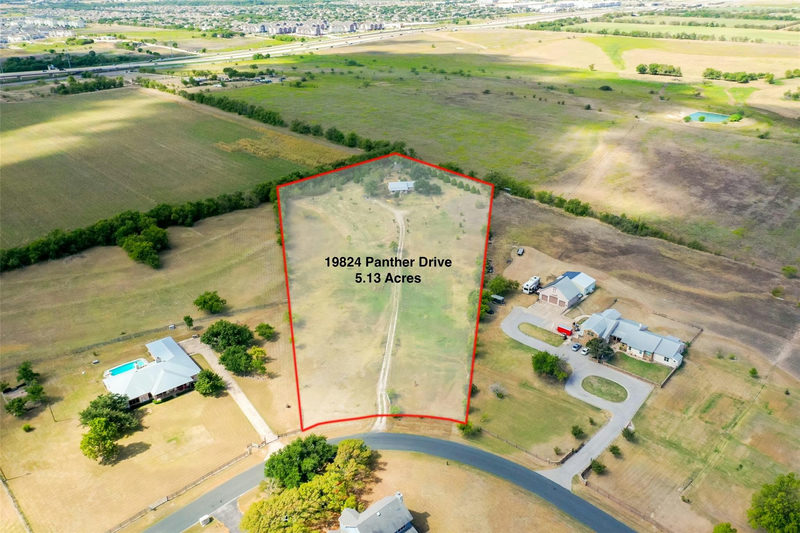
19824 Panther Dr Pflugerville, TX 78660
$4,000,000
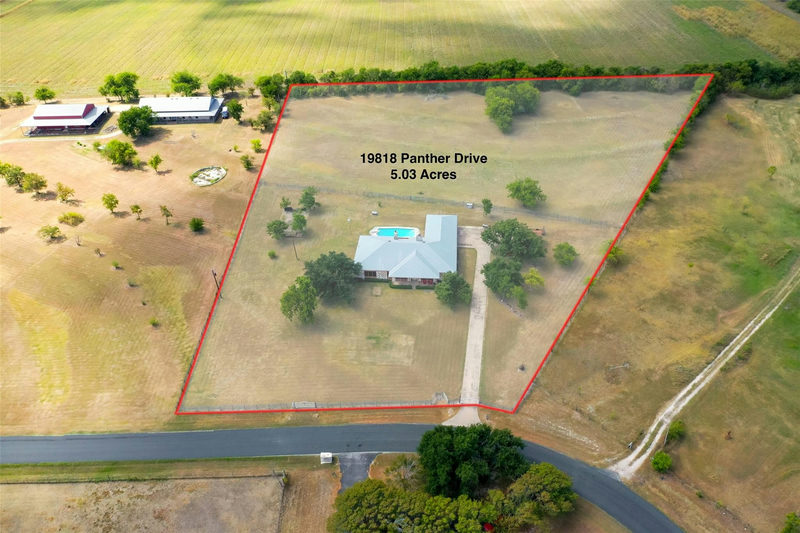
19818 Panther Dr Pflugerville, TX 78660
$4,000,000
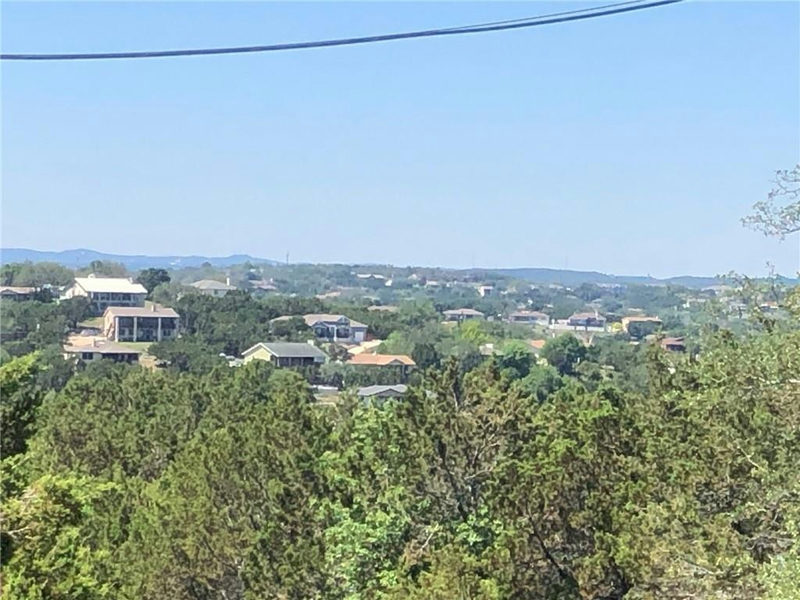
69 Dawn Dr Lago Vista, TX 78645
$69,000
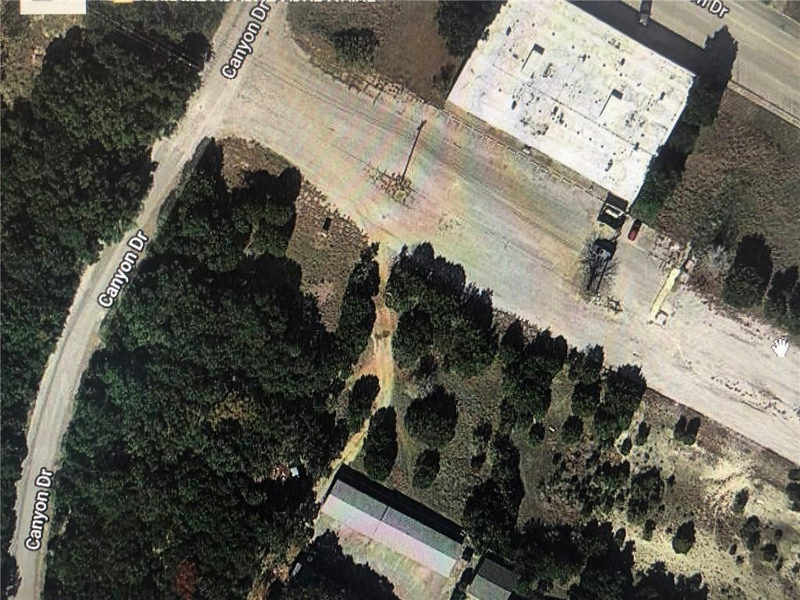
64,65,and 66 Dawn Dr Lago Vista, TX 78645
$180,000
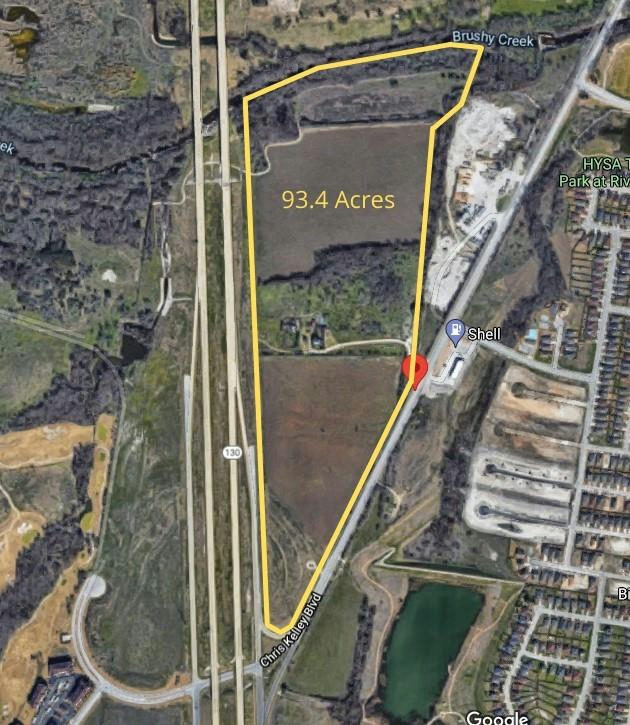
1500 Chris Kelley Blvd Hutto, TX 78634
$35,000,000
21301 Dill Cir Spicewood, TX 78669
$1,686,820
604 Fletcher Austin, TX 78704
$1,999,050
19812 Panther Dr Pflugerville, TX 78660
$3,500,000
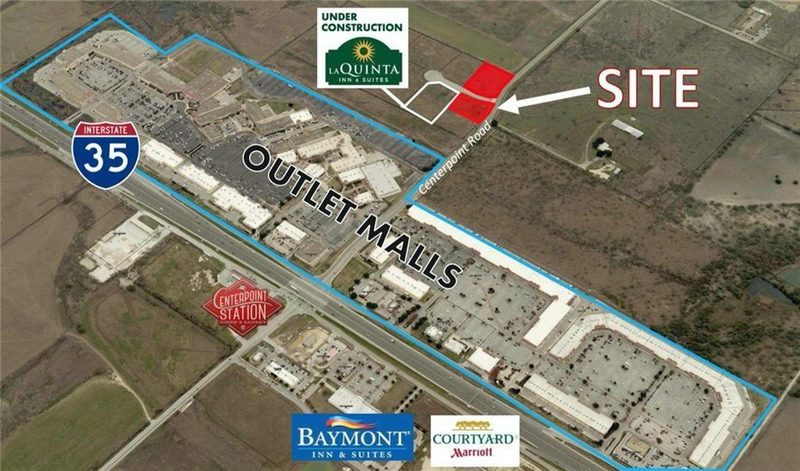
1405 Center Point Rd San Marcos, TX 78666
$975,000
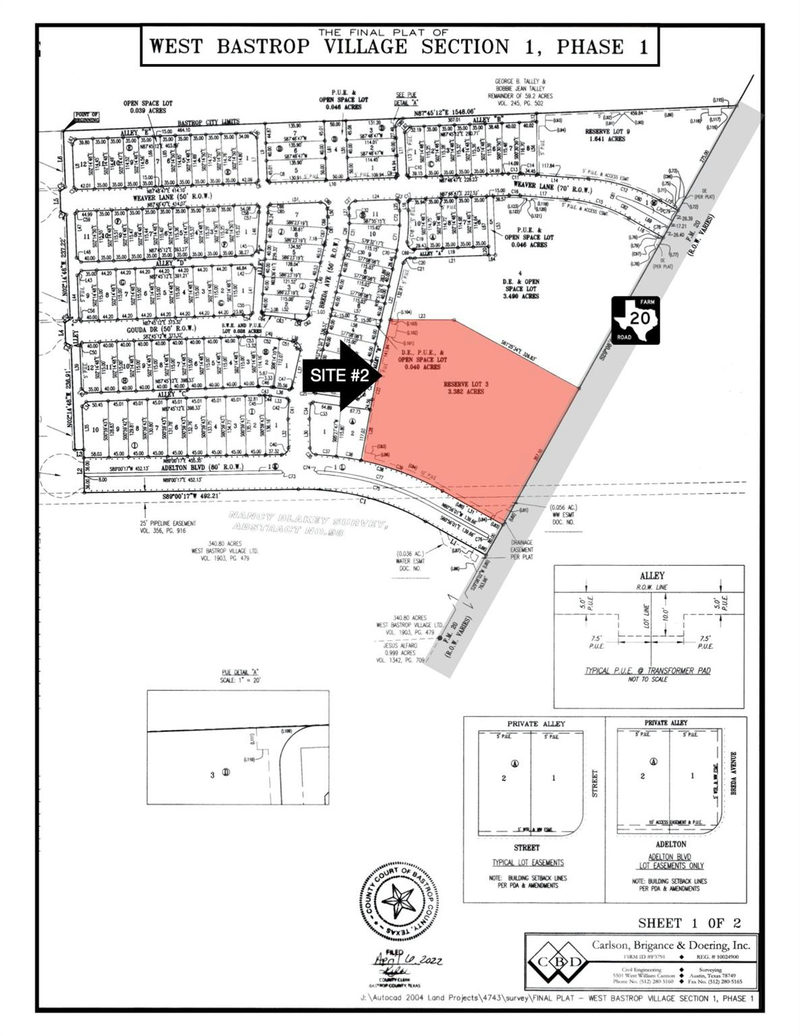
#2 FM 20 Bastrop, TX 78602
$1,104,900
472 County Road 428 Taylor, TX 76574
$450,000
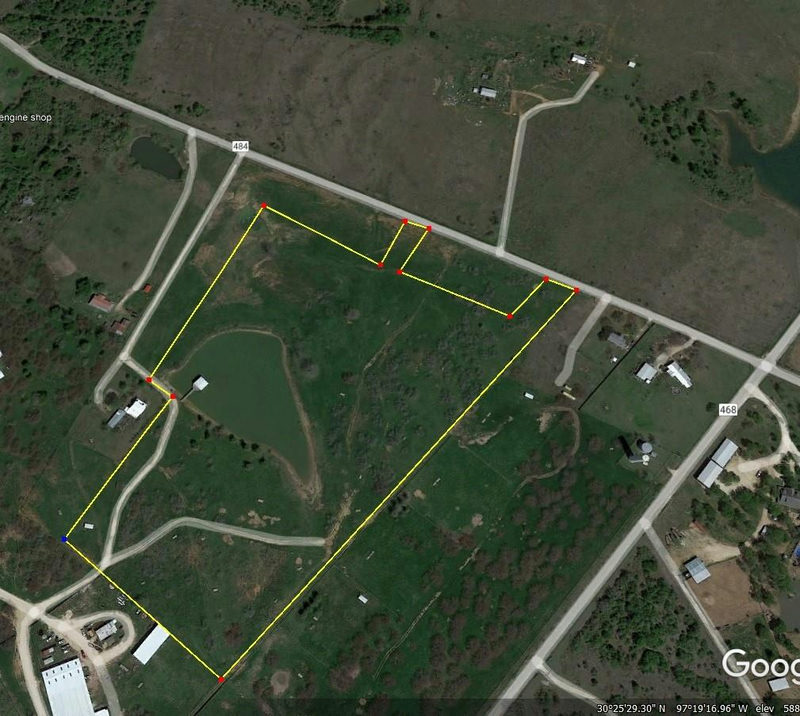
TBD County Rd 484 Elgin, TX 78621
$879,900
The Austin area is a balanced market that favors prepared buyers. Over the last 12 months, 26,120 homes sold in Austin and its main suburbs at a median of $450,000, down 2.2% from $460,000 the year before, on 25,558 sales. Volume is up slightly while prices are down slightly.
The median home took 54 days to go under contract, about the same as the 52 days a year earlier, and sold for 94.6% of its original list price. More than half of the homes that sold, 54%, cut their price at least once. With 11,254 homes for sale, the area has about 5.2 months of supply.
Southwest Austin's 78739 is the tightest ZIP code in the city: 2.1 months of supply, a 16-day median to contract, and homes selling for 98.0% of their original list price at a median of $815,000. 78749 is close behind at an 18.5-day median and 97.7%.
Northwest Austin is also moving quickly. 78759 has 3.1 months of supply and a 27-day median, 78750 has 3.3 months and 27 days, and 78729 has a 22-day median. In these ZIP codes, a well-priced home can go under contract in the first few weeks.
Downtown 78701 has the most supply in the city, 12.7 months, with a median of 82.5 days to contract and homes selling for 92.4% of their original list price. 78705 near the University of Texas has 11.3 months, and Lakeway's 78734 has 9.7 months. 78752, 78741 and 78702 all sit above 8 months.
In these areas, buyers can negotiate on price, repairs and closing costs, and sellers need to launch at the market to avoid a long run of price cuts.
The biggest median price gains over the last year came in 78757 (up 10.3% to $720,000), 78733 (up 8.4% to $1,300,000), 78737 (up 6.3% to $850,000) and 78739 (up 5.5% to $815,000). The largest declines were in 78752 (down 11.1% to $376,000), 78747 (down 9.7% to $369,000), 78701 (down 8.2% to $633,750) and 78721 (down 7.8% to $475,000).
The most expensive ZIP codes remain 78746, with a median of $1,660,000, and 78703, at $1,317,500.
These figures are residential closed sales (single-family, condo and townhome) from the ACTRIS MLS. The metro figures cover Austin plus Round Rock, Cedar Park, Leander, Georgetown, Pflugerville, Hutto, Manor, Kyle, Buda, Dripping Springs, Lakeway, Bee Cave, Spicewood, Lago Vista, Liberty Hill, Del Valle, Manchaca and Driftwood. The ZIP table covers Austin-addressed ZIP codes with at least 40 sales. Leases and sales under $40,000 are excluded. The current period is the 12 months ending September 27, 2026, compared with the 12 months before it. Sale-to-list is the median of each home's sale price divided by its original list price, and days on market are cumulative. We publish totals only, never an individual home's sale price.
Residential closed sales, ACTRIS MLS, 12 months ending September 27, 2026. Sorted by median price.
| ZIP | Homes sold | Median price | vs. last year | Median days on market | Months of supply |
|---|---|---|---|---|---|
| 78746 | 261 | $1,660,000 | -1.5% | 52 | 4.8 |
| 78703 | 224 | $1,317,500 | -3.8% | 56 | 6.1 |
| 78733 | 87 | $1,300,000 | +8.4% | 24 | 3.4 |
| 78730 | 128 | $1,188,500 | -3.4% | 46 | 4.9 |
| 78731 | 356 | $1,085,000 | -3.3% | 41 | 3.6 |
| 78738 | 498 | $870,000 | +3.3% | 44 | 4.0 |
| 78737 | 341 | $850,000 | +6.3% | 33 | 3.5 |
| 78704 | 578 | $840,150 | -6.7% | 60 | 6.5 |
| 78732 | 213 | $835,000 | -3.5% | 49 | 5.0 |
| 78735 | 151 | $830,000 | -7.5% | 47 | 3.3 |
| 78739 | 257 | $815,000 | +5.5% | 16 | 2.1 |
| 78756 | 97 | $749,000 | -7.0% | 40 | 4.2 |
| 78757 | 340 | $720,000 | +10.3% | 38 | 4.2 |
| 78726 | 109 | $697,500 | -2.4% | 37 | 4.1 |
| 78702 | 329 | $670,000 | -2.2% | 49 | 8.1 |
| 78759 | 376 | $662,500 | +4.8% | 27 | 3.1 |
| 78701 | 218 | $633,750 | -8.2% | 82 | 12.7 |
| 78734 | 184 | $629,388 | -6.8% | 68 | 9.7 |
| 78751 | 173 | $627,333 | -3.5% | 40 | 5.6 |
| 78750 | 303 | $600,000 | -3.5% | 27 | 3.3 |
| 78722 | 74 | $599,450 | -2.5% | 42 | 3.2 |
| 78717 | 254 | $598,200 | +4.6% | 30 | 4.4 |
| 78749 | 360 | $579,950 | +0.9% | 18 | 3.4 |
| 78723 | 387 | $552,500 | -4.7% | 37 | 4.7 |
| 78736 | 95 | $525,000 | -5.3% | 26 | 4.8 |
| 78721 | 125 | $475,000 | -7.8% | 66 | 8.1 |
| 78727 | 218 | $469,913 | -5.9% | 29 | 4.3 |
| 78745 | 629 | $455,000 | -5.3% | 42 | 5.4 |
| 78729 | 201 | $450,500 | -0.8% | 22 | 4.4 |
| 78728 | 119 | $415,000 | -3.5% | 40 | 3.9 |
| 78748 | 512 | $410,000 | -7.2% | 41 | 3.7 |
| 78744 | 513 | $400,000 | +1.5% | 70 | 4.4 |
| 78758 | 263 | $387,500 | -5.1% | 56 | 5.4 |
| 78752 | 91 | $376,000 | -11.1% | 36 | 9.0 |
| 78747 | 376 | $369,000 | -9.7% | 80 | 6.6 |
| 78753 | 202 | $359,000 | +1.9% | 48 | 5.8 |
| 78724 | 156 | $355,825 | +4.0% | 46 | 7.5 |
| 78754 | 178 | $355,000 | -6.1% | 45 | 7.9 |
| 78741 | 161 | $341,000 | -1.7% | 68 | 8.9 |
| 78705 | 151 | $300,000 | -7.3% | 76 | 11.3 |
| 78725 | 110 | $271,000 | -5.7% | 40 | 6.7 |
<p>Across Austin and its main suburbs, the median home sold for $450,000 over the 12 months ending September 2026, based on 26,120 residential sales in the ACTRIS MLS. That is down 2.2% from $460,000 the year before. Inside Austin itself the range is wide: the median runs from $271,000 in 78725 to $1,660,000 in 78746, so the ZIP code and home type matter more than the metro number.</p>
<p>Slightly. The metro median fell 2.2% over the last year, from $460,000 to $450,000, while the number of sales rose from 25,558 to 26,120. That is a flat-to-soft market rather than a falling one. Some ZIP codes rose, including 78757 (up 10.3%) and 78733 (up 8.4%), while others fell, including 78752 (down 11.1%) and 78747 (down 9.7%). Direction depends heavily on the part of town.</p>
<p>It is a balanced market overall, with about 5.2 months of supply across the Austin area. The split by ZIP code is sharp. 78739 has 2.1 months of supply and homes sell for 98.0% of their original list price, which behaves like a seller's market. Downtown 78701 has 12.7 months and 78705 has 11.3 months, which gives buyers real leverage. Check the ZIP table on this page for the area you care about.</p>
<p>Over the last 12 months, the fastest ZIP codes by median days to contract were 78739 (16 days), 78749 (18.5 days), 78729 (22 days), 78733 (24 days), 78736 (26 days), and 78759 and 78750 (27 days each). The slowest were 78701 downtown (82.5 days), 78747 (79.5 days), 78705 (76 days) and 78744 (70 days). The metro median is 54 days.</p>
<p>The median Austin-area home took 54 days to go under contract over the last year, counted as cumulative days on market so relisted homes are not reset. Add roughly 30 to 45 days from contract to closing. More than half of sold homes, 54%, cut their price at least once, and those cuts account for much of the time. A home priced in line with recent sales on its street usually goes under contract well inside the median.</p>
<p>Launching above the market. Across the Austin area, 54% of homes that sold had cut their price, and the median home sold for 94.6% of its original list price. The sellers who do best set the first price from the last few months of sales of similar homes nearby. A home that sits and cuts often ends up below what a well-set launch would have brought.</p>
<p>By median sale price over the last 12 months, the most expensive Austin ZIP codes were 78746 ($1,660,000), 78703 ($1,317,500), 78733 ($1,300,000), 78730 ($1,188,500) and 78731 ($1,085,000). Next came 78738 ($870,000), 78737 ($850,000) and 78704 ($840,150). These medians blend condos, older homes and new construction, so neighborhood-level reports give a sharper read inside each ZIP code. Our Tarrytown report, for example, isolates the 89 sales inside that neighborhood from the rest of 78703.</p>
<p>At $600,000 you are close to the median in several central and northwest Austin ZIP codes: 78750 ($600,000), 78722 ($599,450), 78717 ($598,200) and 78749 ($579,950). In 78745 the median is $455,000 and in 78748 it is $410,000, so the same budget buys more space there. In 78704 ($840,150) or 78703 ($1,317,500), $600,000 is typically condo or townhome territory. Filter the live search by ZIP and price to see what is listed today.</p>
<p>Downtown 78701 has the most supply of any Austin ZIP code, 12.7 months, with 231 homes for sale against 218 sales over the last year. The median sale was $633,750, down 8.2%, the median home took 82.5 days to go under contract, and sellers received a median 92.4% of their original list price. Buyers have more negotiating room downtown than anywhere else in the city right now.</p>
<p>Request a home value from us and we will price your home against the closed sales that actually match it: same home type, similar size and lot, and nearby streets, from the last 12 months of ACTRIS MLS data. Your ZIP code's median in the table on this page is a starting point, but condition, lot, updates and street drive most of the difference between two homes a block apart.</p>
Tell us the address or area and we will send a pricing read built from the sales that match it.